
|
Every day, about ten people die from unintentional drowning. Of these, two are children aged 14 or younger. Drowning ranks fifth among the leading causes of unintentional injury death in the United States.
Children ages 1 to 4 have the highest drowning rates. In 2014, among children 1 to 4 years old who died from an unintentional injury, one-third died from drowning. Among children ages 1 to 4, most drownings occur in home swimming pools. Drowning is responsible for more deaths among children 1-4 than any other cause except congenital anomalies (birth defects). Among those 1-14, fatal drowning remains the second-leading cause of unintentional injury-related death behind motor vehicle crashes. How big is the problem?
https://www.cdc.gov/homeandrecreationalsafety/water-safety/waterinjuries-factsheet.html Please research this subject extensively. Stats are subject to change on a daily basis. Remember, it is not the odds, but the stakes.
0 Comments
Very Concerning, Most Bites Occur with Young Children... a Key Factor in This is Poor Dog Body Language Understanding.
Most Dog Bites Occur with a Known Dog, in a Familiar Place
https://kids-n-k9s.com/dog-bite-statistics-for-the-united-states/ Please research this subject extensively. Stats are subject to change on a daily basis. Remember, it is not the odds, but the stakes. According to CR Consumer reports, seventy-eight percent of adult cyclists and 88 percent of young riders who suffered head and neck injuries were not wearing helmets when they were injured, according to a new study published in the journal Brain Injury that analyzed 76,032 cycling injuries between 2002 and 2012. This is troubling, given that earlier research has shown that only about 29 percent of adult cyclists and 42 percent of child cyclists always wear helmets.
The researchers behind the study wanted to examine helmet use among people who had suffered head and neck injuries while cycling. To do so, they used results from the National Trauma Data Bank, which logs patient records from over 900 trauma centers and emergency rooms across the U.S. Injuries were much more severe for anyone not wearing a helmet, and people who suffered injuries that were reported to the database used helmets at low rates. For everyone, the results show that wearing helmets is significantly linked to a reduced risk for longer hospital stays, serious injuries, and death. These findings should help support further study into ways to encourage helmet use, the study authors write. “Education is necessary but not sufficient,” Bazargan-Hejazi says. Researchers need to also look into ways to change attitudes about wearing a helmet and help cyclists better assess the risks of head injury. “I’m guessing people think if they’re not riding fast, they don’t need a helmet,” says Peter Anzalone, senior test project leader for bike helmets at CR, who encourages cyclists of all ages to wear a helmet every time they ride. “People don’t seem to realize how easily they can get severely injured by falling and hitting their head.” https://www.consumerreports.org/head-injuries/most-cyclists-who-suffer-head-injuries-arent-wearing-helmets/ Please research this subject extensively. Stats are subject to change on a daily basis. Remember, it is not the odds, but the stakes. Preventing tobacco product use among youth is critical to ending the tobacco epidemic in the United States.
If cigarette smoking continues at the current rate among youth in this country, 5.6 million of today’s Americans younger than 18 will die early from a smoking-related illness. That’s about 1 of every 13 Americans aged 17 years or younger who are alive today. In 2020, nearly 7 of every 100 middle school students (6.7%) and about 23 of every 100 high school students (23.6%) reported current use of a tobacco product. In 2019, nearly 1 of every 4 middle school students (24.3%) and over half (53.3%) of high school students said they had ever tried a tobacco product.
https://www.cdc.gov/tobacco/data_statistics/fact_sheets/youth_data/tobacco_use/index.htm Please research this subject extensively. Stats are subject to change on a daily basis. Remember, it is not the odds, but the stakes. Homes include one- or two-family homes and apartments or other multi-family housing.
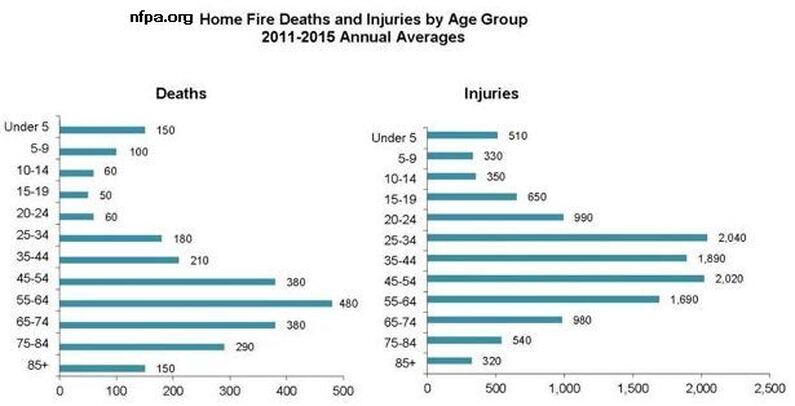 https://www.nfpa.org/News-and-Research/Data-research-and-tools/Building-and-Life-Safety/Home-fire-victims-by-age-and-gender
Please research this subject extensively. Stats are subject to change on a daily basis. Remember, it is not the odds, but the stakes. In the United States and globally, fewer cases of COVID-19 have been reported in children (age 0-17 years) compared with adults. While children comprise 22% of the U.S. population, the most recent data, available through the CDC, show that some cases of COVID-19 in the United States reported to CDC were among children.
The number and rate of cases in children in the United States have been steadily increasing since March 2020. The true incidence of SARS-CoV-2 infection in children is not known due to lack of widespread testing and the prioritization of testing for adults and those with severe illness. Hospitalization rates in children are significantly lower than hospitalization rates in adults with COVID-19, suggesting that children may have less severe illness from COVID-19 compared to adults. Recent evidence suggests that compared to adults, children likely have similar viral loads in their nasopharynx, similar secondary infections rates, and can spread the virus to others. Due to community mitigation measures and school closures, transmission of SARS-CoV-2 to and among children may have been reduced in the United States during the pandemic in the spring and early summer of 2020. This may explain the low incidence in children compared with adults. Comparing trends in pediatric infections before and after the return to child care, in-person school, youth sports and other activities may enhance our understanding about infections in children. https://www.cdc.gov/coronavirus/2019-ncov/hcp/pediatric-hcp.html Please research this subject extensively. Stats are subject to change on a daily basis. Remember, it is not the odds, but the stakes. The statistical problems in real life consist of sampling, inferential statistics, probability, estimating, enabling a team to develop effective projects in a problem-solving frame. For instance, car manufacturers looking to paint the cars might include a wide range of people that include supervisors, painters, paint representatives, or the same professionals to collect the data, which is necessary for the whole process and make it successful. 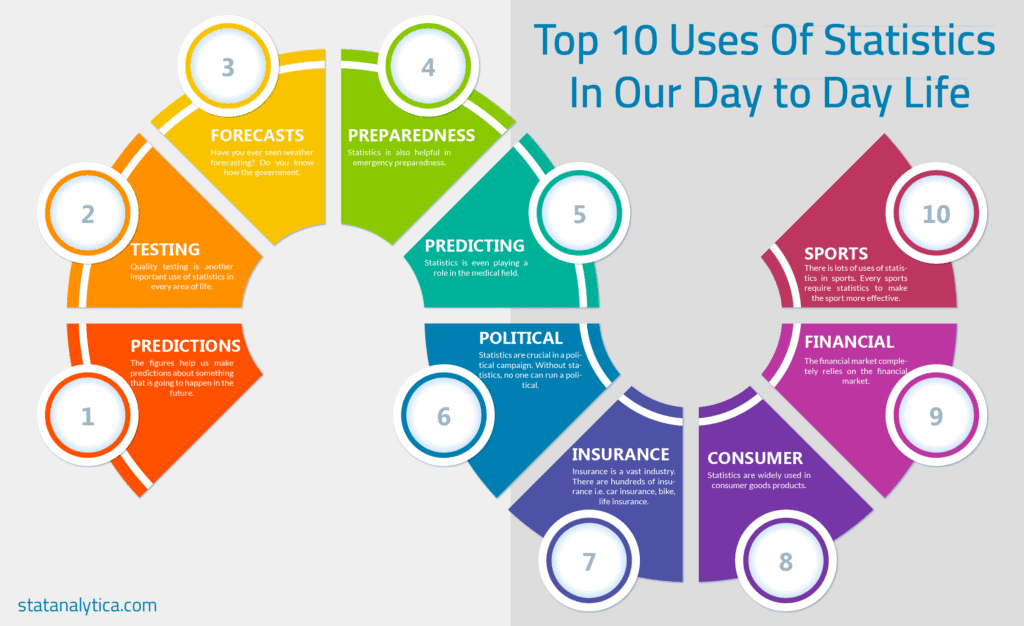 What are uses of statistics?
Statistics is used in every aspect of life, such as in data science, robotics, business, sports, weather forecasting, and much more. There are various other fields where statistics concepts are applied like running, calculating the budget, calories count, and much more. Additionally, statistics help in learning mathematical concepts better. This is how statistics can be used in each aspect of real life. What is the use of statistics in real life? Statistics is used for graphical representation of the collected data. Statistics can compare information through median, mean, and mode. Therefore, statistics concepts can easily be applied to real life, such as for calculating the time to get ready for office, how much money is required to visit work in a month, in education, and much more. Besides this, statistics can be utilized for managing daily routines so that you can work efficiently. What are our plans with the Statistics page? This page will focus on 1 Smart Choice Image Card (scenario/subject) per BLOG and will eventually be listed in CATEGORIES so you can find your subject with ease. The data collected on each subject will be geared towards children ages 13 and under. These are not opinions, we will not offer guidance on any subjects and the Statistics page will not be full of "fluff". This page is intended to supply basic national/regional/local stats on some of the Smart Choices Image Cards that have been chosen as one of the 84 important discussions between you and your child. Please research this subject extensively. Stats are subject to change on a daily basis. Remember, it is not the odds, but the stakes. |
Archives
September 2021
Categories
|
 RSS Feed